I've written sporadically about how the new generation (I guess I am now in senior citizen territory) cannot do simple tasks that we boomers take for granted. Where does the postage stamp go on the envelope? How do I fold the New York Times to read on the train?
I blogged a similar topic here in March 2017.
(http://quicktakespro.blogspot.com/2017/03/the-coming-crash-of-internet.html)
Remember way back when...in school you had to learn basic math even though you had that nice Texas Instruments calculator? I never got the hang of that one but my Casio with none of the fancy functions worked just fine. Who did not enter 01134 and turn it upside down so it says hEll0?
But I digress, as I always do. The point was that you needed to have some math skills to really understand what the calculator was doing. Does the answer makes sense? Did I hit + instead of -? You get the point.
You need map skills to know that blindly following google map directions can get you stuck in rush hour traffic in the heart of downtown Manhattan instead of taking a better route. I also mentioned that last March.
So, even though you do everything by email there will be the odd time when your water bill must be mailed to the utility because they do not take credit cards. You need to know where to put the stamp.
I admit to clinging to the old ways of having a little cash in my pocket and planning my travels in advance. Here is the story. My 22-year old daughter flew back to NY to spend the weekend with friends and of course visit us. She ended up at a friend's summer house in the boondocks of Northern New Jersey and needed to get herself back to us on Long Island Sunday morning. No problem, right?
She asked me for help picking a bus to NYC. How should I know? She finally figured out where the bus was but she had to get there. Did her friends wake up early to drive her? Of course not. But no problem! Uber!
Well, let's say there is not much coverage in the NJ boonies early on a Sunday morning.
Long story, short, I would have know exactly how I was getting back to the city to catch a Long Island bound train on time before I even left for Jersey. I do not expect all of my needs, whether travel or food or even sunscreen, to be waiting on demand in real time for when I summon them.
The bottom line is she waited for her friends to drive back to NYC. Oh, and they did not even drop her off at Penn Station. She had to take the subway.
Millenials are so much more sophisticated than I ever was but they are helpless in the face of any glitch. They are so much smarter than I am yet who gets the call when things go wrong?
OK, I'm done. Where's my prune juice?
And get off my lawn.
Tuesday, July 18, 2017
Tuesday, July 4, 2017
The Fallacy of Analogs
One of the key tenets of technical analysis is that we can use previous patterns to forecast what might happen in the future. It is not the same easy modeling of fractals (please tell me you get the sarcasm). We cannot build the big picture from a lot of little pictures as we can with snowflakes, coast lines and galaxies. And if you think that patterns are self fulfilling prophesies, please stop reading now and navigate to Ihaveaclosedmind.com.
Patterns do not predict the future. They give us a better probability of a future outcome because people act in similar ways when faced with similar situations. You get to define what is similar.
Note the liberal use of the term "similar." Also note the term "probability." If these things worked perfectly as expected then there would be no market.Who would take the other side of an upside pattern breakout if the probability were 100% that the market would rally? That little level of uncertainty allows bulls and bears to place their bets, manage positions and even operate in different time frames.
Now that I've established that patterns work, at least with a decent enough probability to make correct calls, let's look at two patterns together. These are called analogs and they are used to find similar behavior in the past so we can forecast what will happen in the future. Or, patterns in one market vs. another, including a commodity and stocks that gather that commodity.
Who has not found patterns in the Dow that look a lot like the one in place in 1929 just ahead of the crash? Who has not compared the tech bubble to the housing bubble? You get my drift.
Sometimes these analogs are useful (asterisk). But sometimes they look great until you realize you've stumbled upon coincidence?
Check out this overlay of bitcoin and the Nasdaq-100 for a recent six-month period. Both markets were soaring. Super performing FANG stocks (the acronym for the go-go technology names) drove the Nasdaq-100 to dizzying heights. And bitcoin, the new crypto-currency was making different but equally as powerful waves as the next great thing. It kind of made sense that these two world changing markets looked the same.
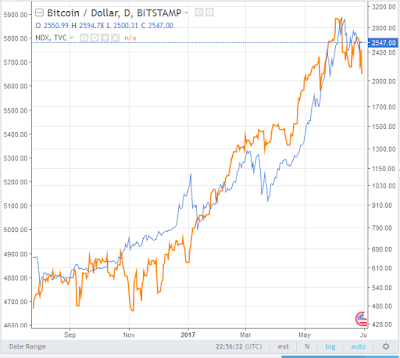
Sure, there are a few times one zigged while the other zagged but overall they tracked each other quite nicely. Therefore, as I write this and the tech sector is getting somewhat hammered in what the bulls hope is the long-awaited correction we can excuse bitcoin's recent weakness. When one turns up, it should signal time to buy the other, too.
Of course, this was a fairly small set of data so let's go back a but farther to see if things still look as good.

This chart shows about twice the span of the first and it is still not too bad. The July 2016 period was a big headache and January 2016 was even worse. However, nobody would argue that they two plots still looked rather similar. Damn! We got something here!
 Um, no.
Bitcoin spent all of 2014 falling while the Nadsaq-100 had another spectacular year.
In statistics, most people find a relationship using one span of data and then test that relationship using a completely independent set of data. The second set is called "out of sample" and it is important to make the case that some theory works all, or at least most, of the time. Testing on data used to create the theory is like eating your own cooking. You may like it but everyone else heads to the vomitorium.
Fun fact - Although we use it for dramatic effect, a vomitorium is not a place to puke after over indulging. It was one of a series of entrance or exit passages in an ancient Roman theater. It means "to spew forth" and they were designed to provide rapid egress for large crowds at amphitheatres and stadiums. Think about that as you head home from the ball park.
Getting back to the topic, there is no analog here. It was coincidence. You know, correlation does not imply causation. Yeah, I don't like that phrase, either.
Then why do we look at them? Perhaps for the same reason we see a man in the moon. We are programmed as humans to look for order where there might not be any. I think it is some primitive survival thing but I'll let you look that one up.
And now for the asterisk. Did you miss it? It was in the fifth paragraph and above the first chart.
Why are these analogs useful at all? My take is that they give us two charts to analyze for support, resistance, trend and pattern at the same time. Then again, you could analyze them completely separately and still find the same support, resistance, trend, pattern and eight-by-ten color glossy photographs with circles and arrows and a paragraph on the back of each one.
Never miss a chance to quote Alice's Restaurant.
Ending on a serious note, stocks and bonds sometimes move together and sometimes they move opposite from each other. Sometimes they compete for investor dollars and sometimes they are risk-on vs. risk-off proxies. The real challenge is knowing which condition is in place sooner rather than later. Is it an inflationary environment or deflationary? Is the economy this or the dollar that? Are we in the old economy or new? Oil or natural gas or solar? Etcetera ad nauseum.
I do not completely dismiss analogs for use in the big picture. I also would use them as I use regular chart patterns in the probability assessment task. However, thinking one market will dictate the fortunes of another is folly. Pure price analysis of the market you trade is still the best way to figure out what you are going to do. Buy, sell or hold. After you show how smart you are with equations, speeches and theorems, it all boils down to what you do. That is the whole point of any analysis.
(charts courtesy of TradingView)
Patterns do not predict the future. They give us a better probability of a future outcome because people act in similar ways when faced with similar situations. You get to define what is similar.
Note the liberal use of the term "similar." Also note the term "probability." If these things worked perfectly as expected then there would be no market.Who would take the other side of an upside pattern breakout if the probability were 100% that the market would rally? That little level of uncertainty allows bulls and bears to place their bets, manage positions and even operate in different time frames.
Now that I've established that patterns work, at least with a decent enough probability to make correct calls, let's look at two patterns together. These are called analogs and they are used to find similar behavior in the past so we can forecast what will happen in the future. Or, patterns in one market vs. another, including a commodity and stocks that gather that commodity.
Who has not found patterns in the Dow that look a lot like the one in place in 1929 just ahead of the crash? Who has not compared the tech bubble to the housing bubble? You get my drift.
Sometimes these analogs are useful (asterisk). But sometimes they look great until you realize you've stumbled upon coincidence?
Check out this overlay of bitcoin and the Nasdaq-100 for a recent six-month period. Both markets were soaring. Super performing FANG stocks (the acronym for the go-go technology names) drove the Nasdaq-100 to dizzying heights. And bitcoin, the new crypto-currency was making different but equally as powerful waves as the next great thing. It kind of made sense that these two world changing markets looked the same.

Sure, there are a few times one zigged while the other zagged but overall they tracked each other quite nicely. Therefore, as I write this and the tech sector is getting somewhat hammered in what the bulls hope is the long-awaited correction we can excuse bitcoin's recent weakness. When one turns up, it should signal time to buy the other, too.
Of course, this was a fairly small set of data so let's go back a but farther to see if things still look as good.

This chart shows about twice the span of the first and it is still not too bad. The July 2016 period was a big headache and January 2016 was even worse. However, nobody would argue that they two plots still looked rather similar. Damn! We got something here!

Bitcoin spent all of 2014 falling while the Nadsaq-100 had another spectacular year.
In statistics, most people find a relationship using one span of data and then test that relationship using a completely independent set of data. The second set is called "out of sample" and it is important to make the case that some theory works all, or at least most, of the time. Testing on data used to create the theory is like eating your own cooking. You may like it but everyone else heads to the vomitorium.
Fun fact - Although we use it for dramatic effect, a vomitorium is not a place to puke after over indulging. It was one of a series of entrance or exit passages in an ancient Roman theater. It means "to spew forth" and they were designed to provide rapid egress for large crowds at amphitheatres and stadiums. Think about that as you head home from the ball park.
Getting back to the topic, there is no analog here. It was coincidence. You know, correlation does not imply causation. Yeah, I don't like that phrase, either.
Then why do we look at them? Perhaps for the same reason we see a man in the moon. We are programmed as humans to look for order where there might not be any. I think it is some primitive survival thing but I'll let you look that one up.
And now for the asterisk. Did you miss it? It was in the fifth paragraph and above the first chart.
Why are these analogs useful at all? My take is that they give us two charts to analyze for support, resistance, trend and pattern at the same time. Then again, you could analyze them completely separately and still find the same support, resistance, trend, pattern and eight-by-ten color glossy photographs with circles and arrows and a paragraph on the back of each one.
Never miss a chance to quote Alice's Restaurant.
Ending on a serious note, stocks and bonds sometimes move together and sometimes they move opposite from each other. Sometimes they compete for investor dollars and sometimes they are risk-on vs. risk-off proxies. The real challenge is knowing which condition is in place sooner rather than later. Is it an inflationary environment or deflationary? Is the economy this or the dollar that? Are we in the old economy or new? Oil or natural gas or solar? Etcetera ad nauseum.
I do not completely dismiss analogs for use in the big picture. I also would use them as I use regular chart patterns in the probability assessment task. However, thinking one market will dictate the fortunes of another is folly. Pure price analysis of the market you trade is still the best way to figure out what you are going to do. Buy, sell or hold. After you show how smart you are with equations, speeches and theorems, it all boils down to what you do. That is the whole point of any analysis.
(charts courtesy of TradingView)
Subscribe to:
Posts (Atom)