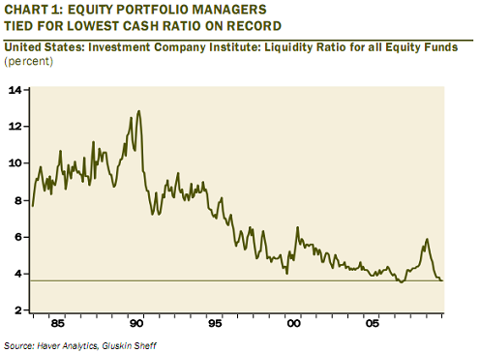
As charts below from the ICI illustrates, portfolio managers have been so nervous to miss any up-moves that they have run down their cash holdings to 3.6% of assets from nearly 6% a year ago — the largest decline in 19 years. Equity cash ratios are back to where they were in September 2007, just as the stock market was hitting its peak.
My own retirement account is half cash.

4 comments:
Michael, your warning reminds me of your advice from Oct 17, 2007 in Barrons "This is not about picking a top. It is more about reducing risk". And now that cash ratios are as low as in late 2007, we need to watch for risk alright. The only difference between the two time periods is that in late 2007 the US dollar was going down, and now the USD is going up. Must mean something.
Also, Randall Forsyth, March 4 in Barrons mentioned that all the activity seemed to be coming from the pros, while the individual investor is sitting it out. Combined with your blog column today, it means the pros have brought down the cash ratios, while the individuals are still more heavily in cash. Wonder what this means - the indivuals jump in and cause an upswing or pros get out and cause a more severe correction.
Anyone looking at that chart must be concerned, no matter how bullish or bearish they are. It is amazing to see how much cash used to be held back. This chart seems to validate that most money managers have very short holding periods and are really day/swing trading the market - which would mean their is very little support for prices should sentiment suddenly turn negative.
Amalan, you flatter me with your research. I think I will revisit that article to see if it makes sense to re-run in updated form.
I'll post an excerpt from today's newsletter in a few minutes.
Steven, this is another point I have been trying to make, only from the volume point of view. Low volume means less buffer against news. As you said, that leaves very little support should sentiment turn.
Post a Comment